Energy by weight
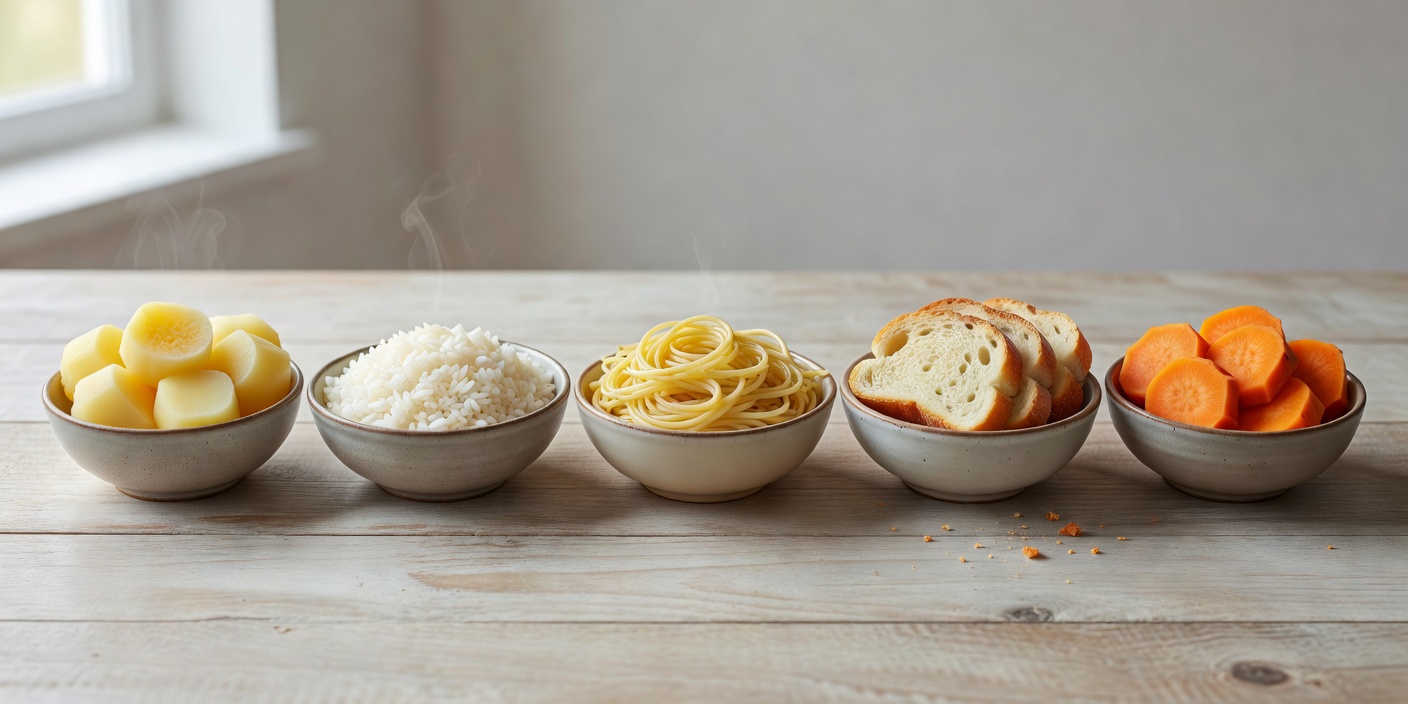
McCance and Widdowson's The Composition of Foods lists boiled potato at a lower energy value per 100 g than cooked white rice or cooked pasta, and at far below bread. The reason is water. A boiled potato is roughly three quarters water; cooked rice and pasta are closer to two thirds; bread is around a third. Per gram of dry carbohydrate the staples are similar, so the comparison changes if portions are matched by energy rather than weight. In practice most people serve potatoes by weight or by count, which is why the by-weight figure is the one usually quoted. Fried potato reverses the picture: chips and crisps have a higher energy density than any of the plain staples because of the oil they absorb, as the cooking methods report sets out.
Potassium and vitamin C
Potato is the clear leader on both. White rice, pasta and bread supply little potassium and effectively no vitamin C. Sweet potato is also a source of potassium and contains some vitamin C, and carries beta-carotene, which the body converts to vitamin A, in amounts the others do not approach. The nutrients report gives the UK reference intakes.
Fibre
Here the ranking depends on refinement. Wholemeal bread, wholewheat pasta and brown rice contain more fibre per 100 g than skin-on boiled potato. White bread, white pasta and white rice contain less. Peeled potato falls further. Sweet potato with skin is broadly comparable with skin-on potato. The Eatwell Guide's advice to choose wholegrain or higher-fibre versions applies across the group, and for potatoes that means leaving the skin on.
5 A Day status
The NHS counts sweet potato, parsnip, swede and turnip towards 5 A Day and does not count potato, yam, cassava or plantain. Rice, pasta and bread do not count either. The reasoning is explained in the Eatwell Guide report: it concerns the role a food plays in a meal, not its composition. A person choosing between a jacket potato and a baked sweet potato gains a 5 A Day portion with the sweet potato; the two are otherwise close in energy and both belong to the starchy segment for planning purposes.
Gluten
Potato, sweet potato and rice are naturally free of gluten. Wheat pasta and most bread are not. Coeliac UK, the charity for people with coeliac disease, lists potatoes among the staple foods that can be eaten freely on a gluten-free diet. That makes potatoes a common substitute for bread and pasta for people with coeliac disease or non-coeliac gluten sensitivity, subject to checking that any coating, sauce or processing has not introduced wheat.
Salt and contaminants
Bread is one of the largest single contributors to salt intake in the UK because of the quantity eaten and the salt added in baking; Public Health England's salt reduction programme has set targets for it. Plain potatoes, rice and pasta contain almost no sodium before cooking. Rice carries a separate consideration: it takes up inorganic arsenic from soil and water more readily than other cereals, and the Food Standards Agency advises against giving rice drinks to children under five as a substitute for milk. Potatoes are not associated with an equivalent concern; the issues specific to them are acrylamide in browned products and glycoalkaloids in green tubers, both covered elsewhere on this site.
Cost and waste are part of a fair comparison. WRAP, the UK waste-reduction charity, has repeatedly identified fresh potatoes among the foods most wasted by weight in UK households, largely through spoilage in storage. Buying smaller quantities and storing them in the dark, as the varieties report describes, reduces that.
Summary table
| Staple | Energy per 100 g cooked | Potassium and vitamin C | Fibre | 5 A Day | Gluten |
|---|---|---|---|---|---|
| Boiled potato, skin on | Lowest of the group | Highest of the group | Moderate | No | Free |
| Sweet potato, baked | Low | Good; also beta-carotene | Moderate | Yes | Free |
| White rice, cooked | Higher than potato | Low | Low | No | Free |
| Pasta, cooked | Higher than potato | Low | Low (white); higher (wholewheat) | No | Contains |
| Bread | Highest of the group | Low | Low (white); higher (wholemeal) | No | Contains |
Exact values by product are in the composition tables and on packaging. The direction of each comparison above is stable; the precise gap varies with variety, brand and cooking.